Now we are adding one more thing in our development environment which will help in debugging Windchill method server in eclipse. Below settings are specific to Windchill 9.1 release.
- Set method server running port
In /codebase/wt.properties.xconf edit below property to add method server port and java memory allocations
name="wt.manager.cmd.MethodServer.platform.java.args"
default="$(wt.manager.cmd.MethodServer.nonibm.java.args)"
This property pointing to different property again so ultimately we need change
name="wt.manager.cmd.MethodServer.nonibm.java.args" default="-XX:PermSize=72m -XX:MaxPermSize=200m"
Note: The “default” value can be different in your environment.
Change the default value as highlighted below
name="wt.manager.cmd.MethodServer.nonibm.java.args" default="-XX:PermSize=72m
-XX:MaxPermSize=200m -Xdebug -Xnoagent -Xrunjdwp:transport=dt_socket,
server=y, suspend=n, address=7777 -Djava.compiler=NONE"
- Run xconfmanager utility
- Restart method server
Once you restart the method server, the method server will start running on port (7777) specified in the property above.
Note:
You can check the method server running port in the method server logs.
The very first line will show the method server running port.
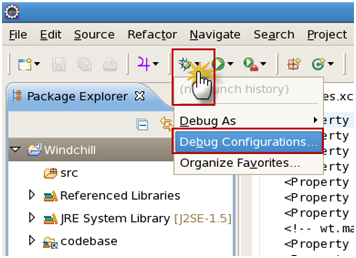
- Eclipse debugging setup
- Click on Debug -> Debug configurations
- Navigate to “Remote Java Application” -> “New”
- Provide Name, Host and Port. Click on “Apply”.
- Click on “Debug”.
- If all the properties and setting specified are correct, you will see the eclipse started in debug mode (Note: Method server must be up and running)
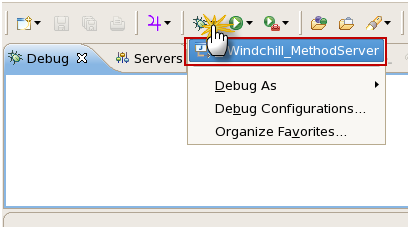
- Later on you can start method server debugging from Debug drop down directly by selecting your newly created “Remote Java Application” under “Debug”


Now you can do Windchill method server debugging as normal as Java project in eclipse.
8 comments:
BrAvo..... you made Windchill Dev's life easy !!!!
People should get away from SYSOUTs.
Good!!!
Best luck for next topic...
Keep the good work up :)
Nice Post! I've been able to successfully debug both a foreground and background methodserver on separator ports (6000 and 6001).
Have you got any idea how to set unique ports for multiple foreground methodservers or make methodservers share the same port?
Thanks.
Do you know if these are the same steps for 10.2?
Hi Mahesh
Thanks nice post.
I am actually building a framework API of Publishing where I am using ManagerService in my API, like example :- ContentServiceHelper.manager.updateContent();
But above API throws error of manager service not initialized,
I want to test my Soap Framework API's from eclipse.
My project is already set and is getting debugged properly but when i use this manager service's it throws error.
This is integeration of PDMLink to SAP and then PDF (3rd party tool acrobat)
Kindly suggest what should I do , either as above debugging MS debug offcourse puttimg my code in PDMLink and then try debugging MS .Can i change the code runtime and debug again or soemthing else.
Thanks & Regards
Rashmi Singh
Hi,
For 10.2 the instructions are a little different. For instance, the Debug Configuration is already created in the Eclipse project.
For the MethodServer changes you should run the following:
xconfmanager -s "wt.manager.cmd.MethodServer.debug.args=-Xnoagent -Xdebug -Xrunjdwp:transport=dt_socket,address=9000,server=y,suspend=n" -t wt.properties -p
If you run "ant -f bin/tools.xml eclipse_project.help" from a Windchill shell in 10.2 you will PTC's exact information.
Hi,
Nice and handy post to get rid of stubborn sysouts.
Post a Comment